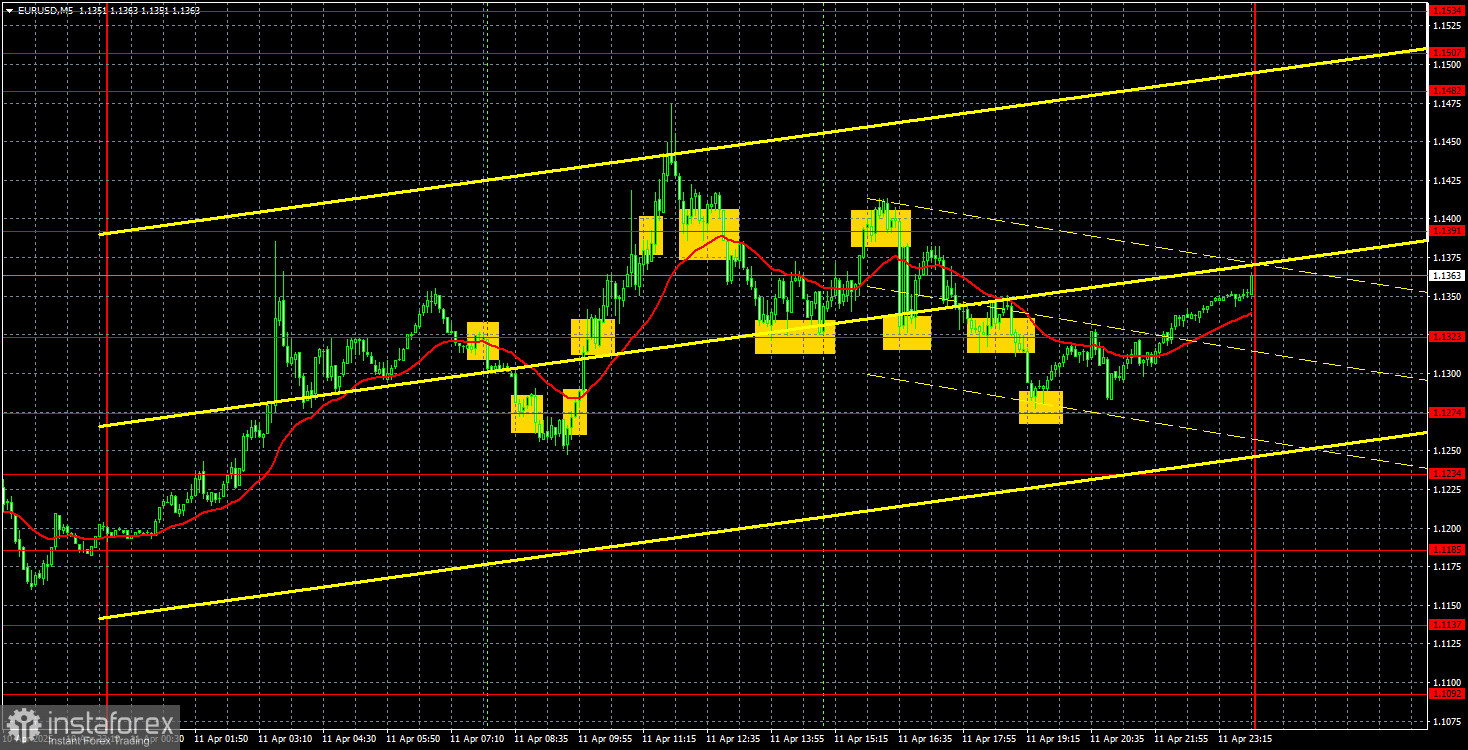
EUR/USD 5-Minute Analysis
On Friday, the EUR/USD currency pair continued its ultra-strong rally—something no one was surprised by anymore. U.S. and China reciprocal tariffs continue to rise, while all other news remains irrelevant to traders. Currently, the usual macroeconomic background has little effect on currency movements. These data points fade in the shadow of the trade war narrative. Everyone in the market understands that this war could leave a lasting mark not just on the U.S. or Chinese economies but globally. And the dollar is the main "culprit." That's why the market keeps selling the dollar, and Trump's announcements of tariff exemptions no longer impress anyone—they don't change the bigger picture.
Trump granted a 90-day grace period—so what changed? Have tariffs stopped working? No. Has Trump made meaningful steps toward negotiating with his trade partners? Also no. He's still in the White House playing golf—something he used to criticize Barack Obama for harshly. The president waits for delegations worldwide to crawl to him on their knees and beg for a trade deal. But the market sees clearly: no one is lining up at the White House.
Market moves remain strong, chaotic, and risky. As a result, many trading signals are being generated. There's little sense in analyzing each one individually. It's enough to say that the price movements aren't particularly clean, despite appearances. On Friday, the pair frequently reversed direction, and volatility was high. Many levels are ignored as the market trades on impulse and emotion. We'd say that strong signals, to some extent, are now more a matter of luck than precision.
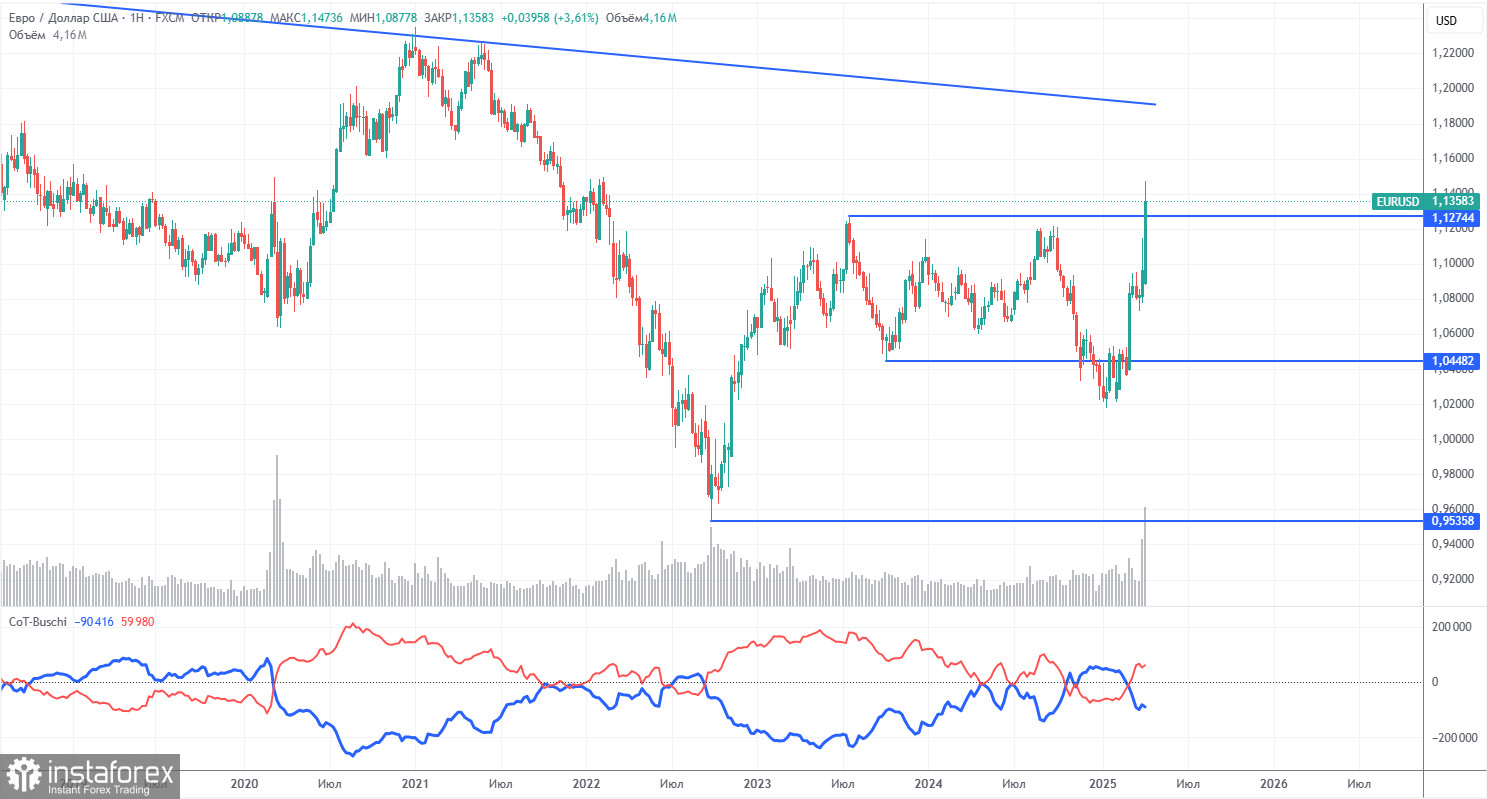
COT Report
The latest COT report is dated April 8. As shown in the chart above, the net position of non-commercial traders remained in bullish territory for a long time. The bears barely managed to take control, but now bulls have regained the initiative. The bears' advantage has diminished since Trump took office, and the dollar has begun to fall.
We can't say with certainty that the dollar will continue to decline, and COT reports reflect the sentiment of large players, which can shift very quickly in the current circumstances.
We still don't see any fundamental factors supporting euro strength, but a major factor is now contributing to dollar weakness. The pair may correct for several more weeks or months, but a 16-year downward trend doesn't reverse overnight.
The red and blue lines have now crossed again, signaling a bullish trend. During the last reporting week, the number of long positions held by the "non-commercial" group increased by 7,000, while short positions dropped by 1,100—resulting in a net increase of 8,100 contracts.
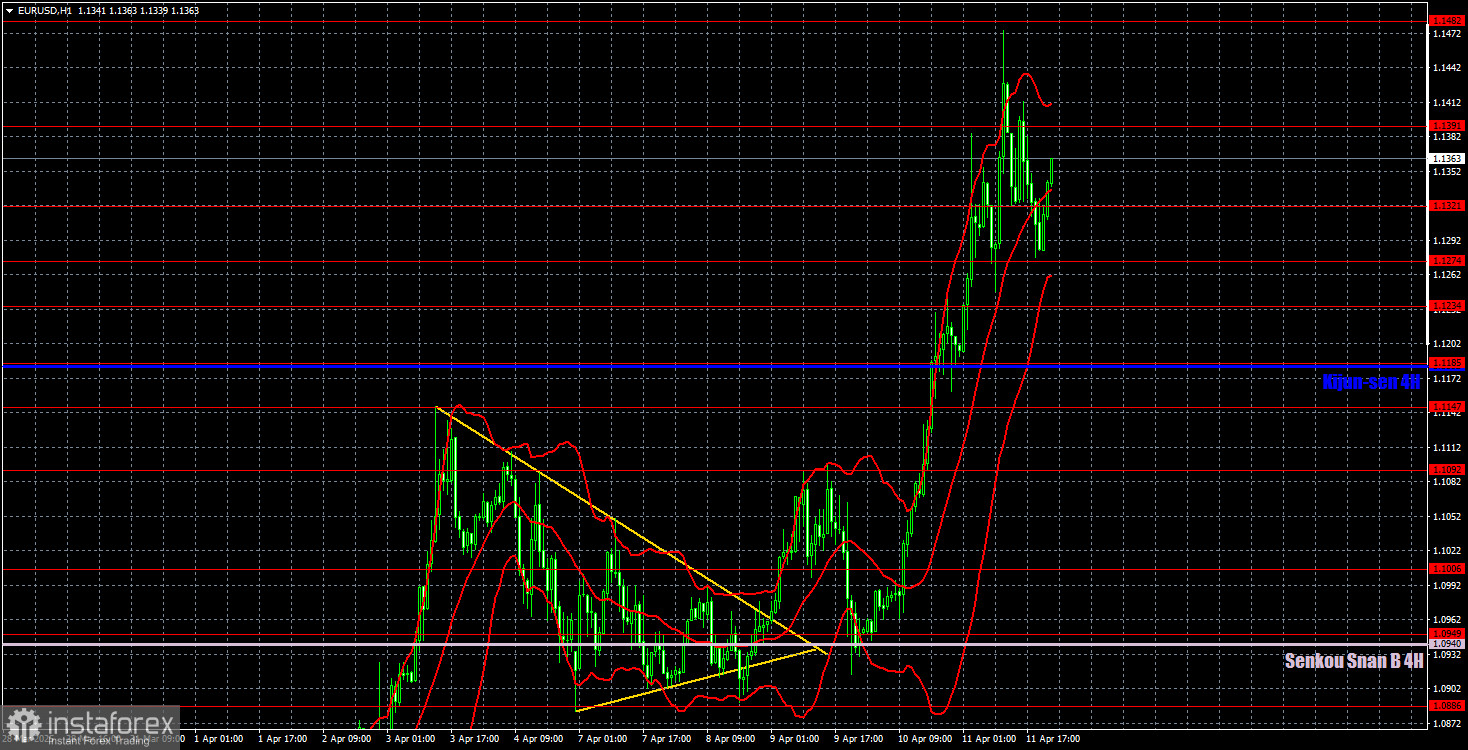
EUR/USD 1-Hour Analysis
The EUR/USD pair quickly resumed its uptrend in the hourly time frame when Trump announced new tariffs. We believe that a medium-term decline will eventually resume, but it's unclear how long the market will continue responding solely to the "Trump factor"—or where the pair will end up. And how long will Trump keep escalating global tensions?
Right now, the markets are gripped by panic and chaos. If we weren't willing to forecast price movement even a week ahead before, we certainly wouldn't do so now. The only sensible advice is to wait out the crisis or trade intraday only.
For April 14, we highlight the following levels for trading - 1.0757, 1.0797, 1.0823, 1.0886, 1.0949, 1.1006, 1.1092, 1.1147, 1.1185, 1.1234, 1.1274, 1.1323, 1.1391, 1.1482, as well as the Senkou Span B (1.0940) and Kijun-sen (1.1182) lines. Ichimoku indicator lines can shift during the day, so they must be adjusted when identifying trade signals. Also, don't forget to set your Stop Loss to break even if the price moves 15 pips in the correct direction. This protects against potential losses if the signal turns out to be false.
No significant events are scheduled for Monday in either the U.S. or the EU—but none are needed. A new "Trump's Trade War" chapter begins on Monday, and plenty of news is expected. Strong market movements are likely once again.
Illustration Explanations:
- Support and Resistance Levels (thick red lines): Thick red lines indicate where movement may come to an end. Please note that these lines are not sources of trading signals.
- Kijun-sen and Senkou Span B Lines: Ichimoku indicator lines transferred from the 4-hour timeframe to the hourly timeframe. These are strong lines.
- Extreme Levels (thin red lines): Thin red lines where the price has previously bounced. These serve as sources of trading signals.
- Yellow Lines: Trendlines, trend channels, or any other technical patterns.
- Indicator 1 on COT Charts: Represents the net position size for each category of traders.