EUR/USD 5-Minute Analysis
The EUR/USD currency pair attempted to extend its growth during Monday's session but eventually pulled back in the second half of the day. In essence, we didn't see any substantial gains for the U.S. dollar again — because Donald Trump, even when he's not imposing new tariffs, still ends up imposing new tariffs. Just over the weekend, Trump announced that certain electronics would be exempt from import duties, but on Monday, the U.S. president reversed that decision. In addition, he stated that the U.S. is preparing to impose tariffs on all semiconductors. Thus, we can again talk about a new escalation in the trade war — but not the opposite.
From a technical point of view, the picture remains unchanged in the 1-hour timeframe. There is no clear trendline or channel that can be drawn at this time. There were no significant events or reports in the Eurozone or the U.S. on Monday, yet the pair still showed high volatility and several intraday reversals. That's why we hold this perspective: market movements are erratic right now, and any strong trading signal is more of a coincidence than a rule.
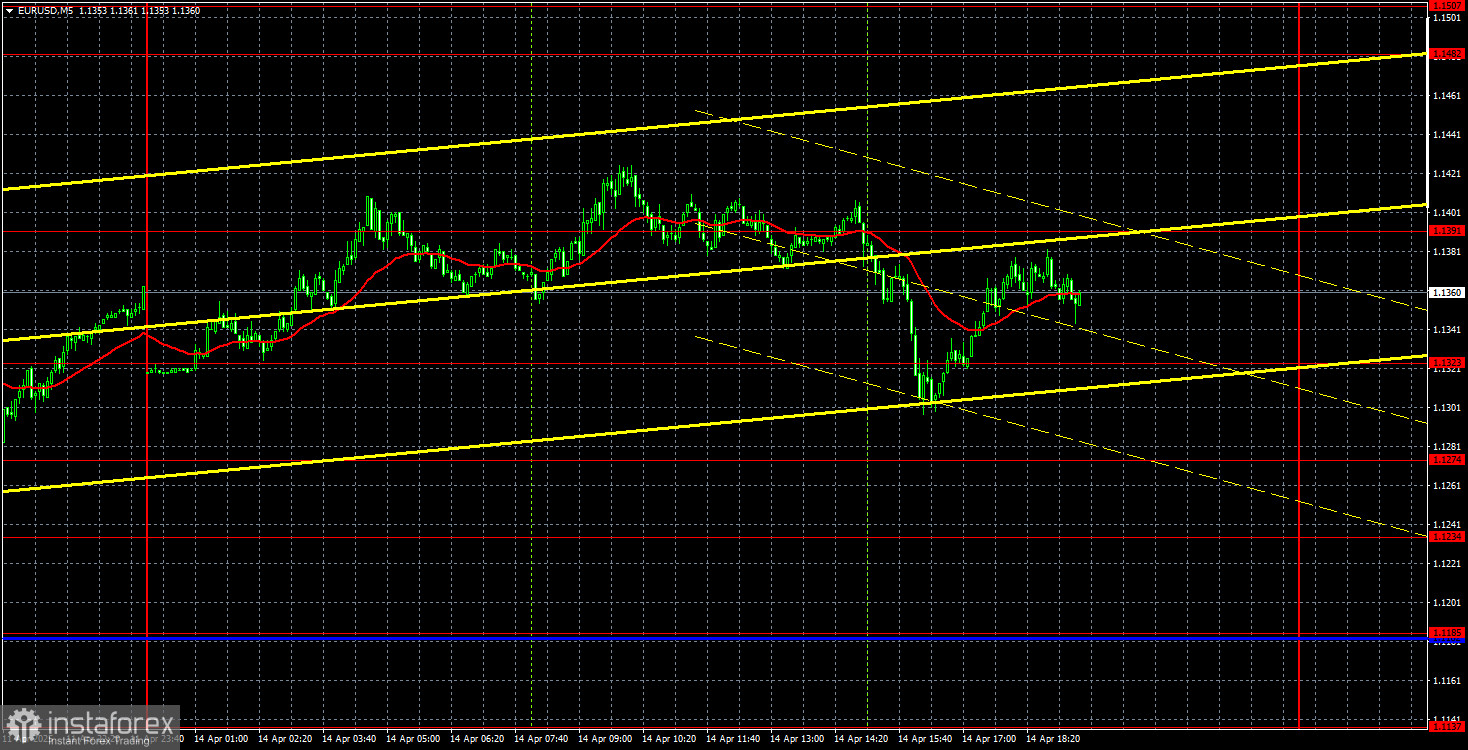
In the 5-minute timeframe, we did not identify any trade signals again. This is because the price ignored all levels throughout the day, and the Ichimoku indicator lines are well below current price levels. The price movement has been extremely chaotic, as we've mentioned before. Today, if Trump introduces new tariffs — the dollar will continue plunging into the abyss.
COT Report
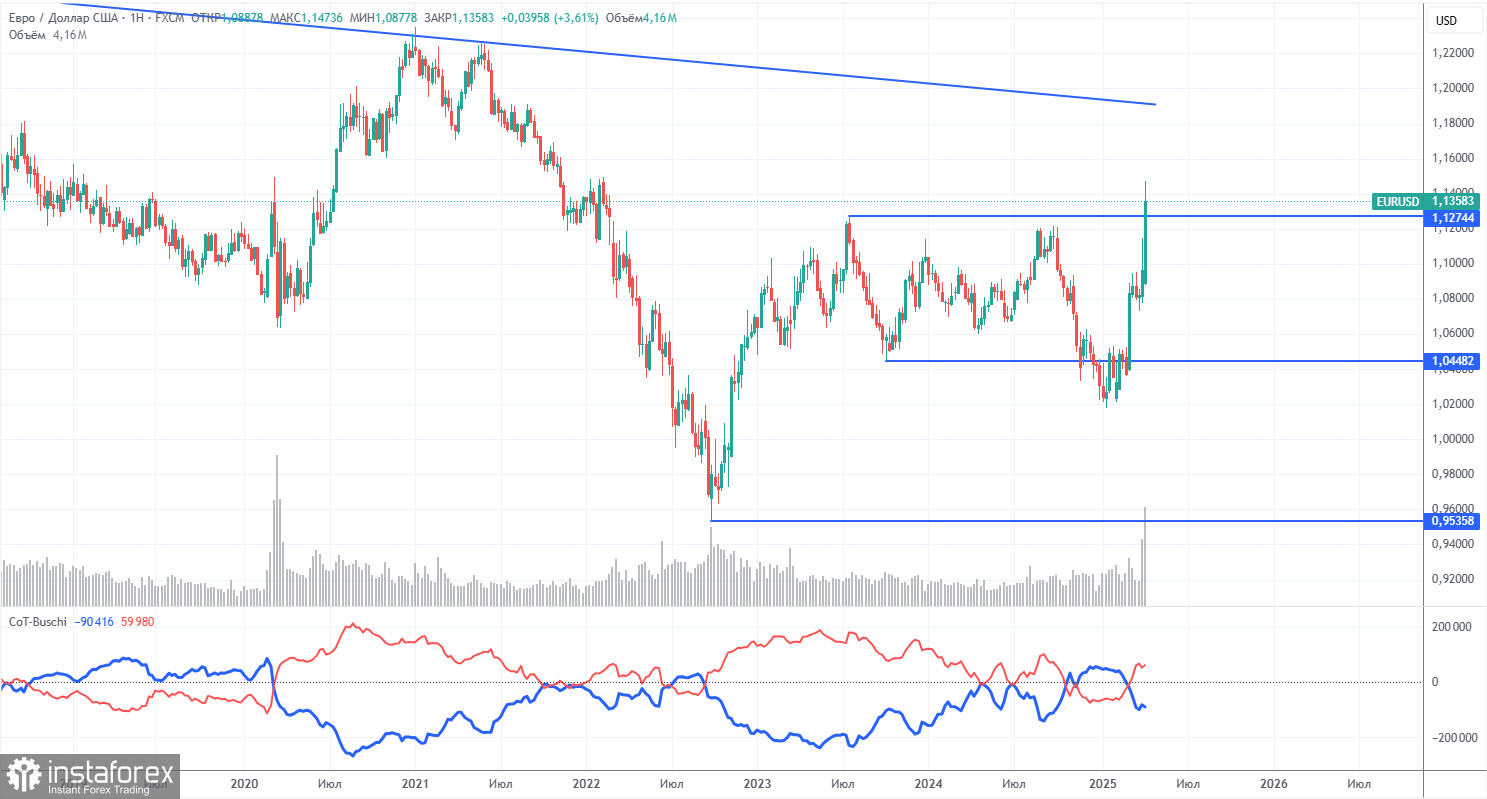
The latest COT report is dated April 8. As shown in the chart above, the net position of non-commercial traders remained in bullish territory for a long time. The bears barely managed to take control, but now bulls have regained the initiative. The bears' advantage has diminished since Trump took office, and the dollar has begun to fall.
We can't say with certainty that the dollar will continue to decline, and COT reports reflect the sentiment of large players, which can shift very quickly in the current circumstances.
We still don't see any fundamental factors supporting euro strength, but a major factor is now contributing to dollar weakness. The pair may correct for several more weeks or months, but a 16-year downward trend doesn't reverse overnight.
The red and blue lines have now crossed again, signaling a bullish trend. During the last reporting week, the number of long positions held by the "non-commercial" group increased by 7,000, while short positions dropped by 1,100—resulting in a net increase of 8,100 contracts.
EUR/USD 1-Hour Analysis
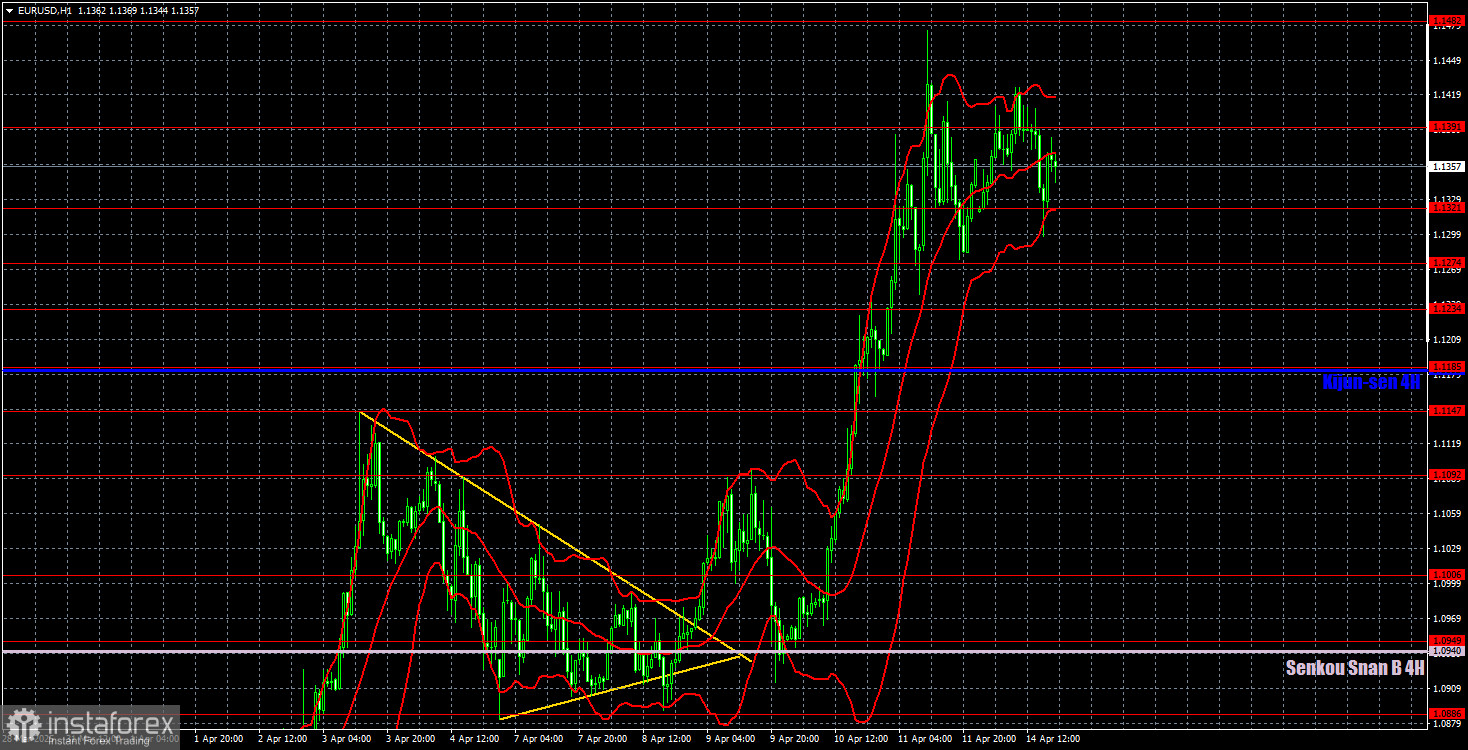
In the hourly timeframe, the EUR/USD pair resumed its upward movement as soon as Trump announced new tariffs. We believe the downtrend will resume in the medium term; however, it's impossible to say how long the market will continue to price in the "Trump factor" — or where the pair will be by then. Right now, the market is ruled by panic and chaos. If we previously avoided forecasting price action even a week ahead, it is even more unrealistic now. Our only advice is to wait for the "crisis" to pass or stick to intraday trading only.
For April 15, the key trading levels are 1.0757, 1.0797, 1.0823, 1.0886, 1.0949, 1.1006, 1.1092, 1.1147, 1.1185, 1.1234, 1.1274, 1.1323, 1.1391, 1.1482, as well as the Senkou Span B line (1.0940) and the Kijun-sen line (1.1182). Remember that Ichimoku indicator lines may shift throughout the day, which should be considered when interpreting trading signals. Don't forget to set a Stop Loss to breakeven once the price moves 15 pips in the right direction. This will protect you from possible losses if the signal is false.
Looking ahead to Tuesday, the day's most important reports will be the ZEW Economic Sentiment Indices for the Eurozone and Germany and Eurozone industrial production. But it hardly needs repeating: these reports currently hold little to no weight. Even if they trigger some market reaction, the overall direction of movement is unlikely to change.
Illustration Explanations:
- Support and Resistance Levels (thick red lines): Thick red lines indicate where movement may come to an end. Please note that these lines are not sources of trading signals.
- Kijun-sen and Senkou Span B Lines: Ichimoku indicator lines transferred from the 4-hour timeframe to the hourly timeframe. These are strong lines.
- Extreme Levels (thin red lines): Thin red lines where the price has previously bounced. These serve as sources of trading signals.
- Yellow Lines: Trendlines, trend channels, or any other technical patterns.
- Indicator 1 on COT Charts: Represents the net position size for each category of traders.