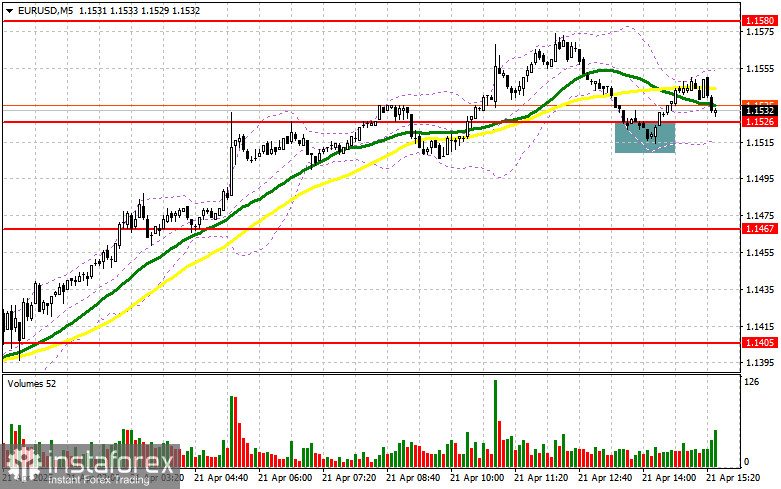
In my morning forecast, I highlighted the level of 1.1526 and planned to make entry decisions based on it. Let's look at the 5-minute chart and see what happened. A decline followed by a false breakout around 1.1526 provided a good entry point for buying the euro, resulting in only a 30-point rise in the pair. The technical picture was not significantly revised for the second half of the day.
To open long positions on EUR/USD:
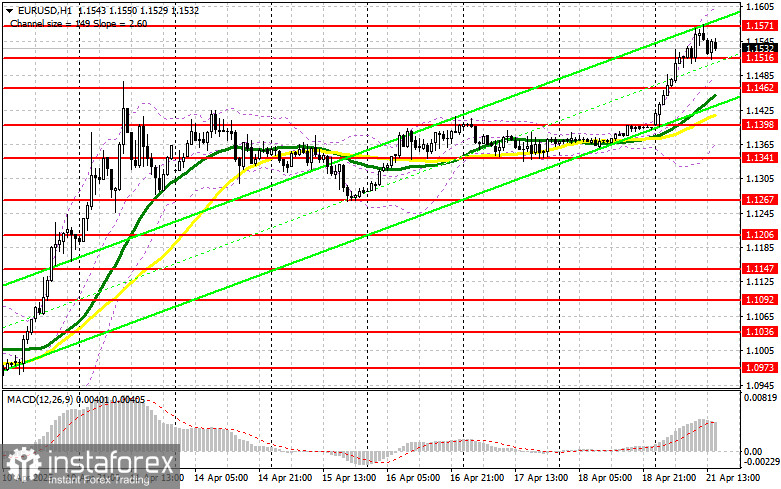
In the second half of the day, we are expecting a speech from FOMC member Austan D. Goolsbee and the release of the Leading Indicators Index. We are unlikely to hear anything new, so I expect demand for the euro to remain intact. I plan to act on any decent pullback of the pair. In the event of a decline, only a false breakout around the 1.1516 support will serve as a reason to buy EUR/USD in anticipation of the continued bullish market and a potential retest of 1.1571, which the pair failed to reach in the first half of the day. A breakout and retest of this range will confirm a proper entry point for long positions with a move toward the 1.1624 area. The furthest target will be 1.1674, where I will take profit.
In the scenario of a decline in EUR/USD and lack of activity around 1.1516, pressure on the euro will increase, potentially leading to a deeper correction. Bears will then aim for 1.1462. Only after a false breakout forms there will I consider buying the euro. I also plan to open long positions on a rebound from 1.1398 with the goal of a 30–35-point intraday correction.
To open short positions on EUR/USD:
If the euro rises in the second half of the day, only a false breakout around 1.1571 will serve as a signal to open short positions with a target at 1.1516 support. A breakout and consolidation below this range, amid a lack of major US statistics, will be an appropriate selling scenario with a move toward 1.1462, where the moving averages are located, favoring the bulls. The furthest target will be 1.1398, where I will take profit.
If EUR/USD continues to rise in the second half of the day, and bears remain inactive around 1.1571, buyers may push the pair to another annual high. In this case, I will postpone short positions until a test of the next resistance at 1.1624. I will sell there only after a failed consolidation. I plan to open short positions immediately on a rebound from 1.1674 with the goal of a 30–35-point correction.
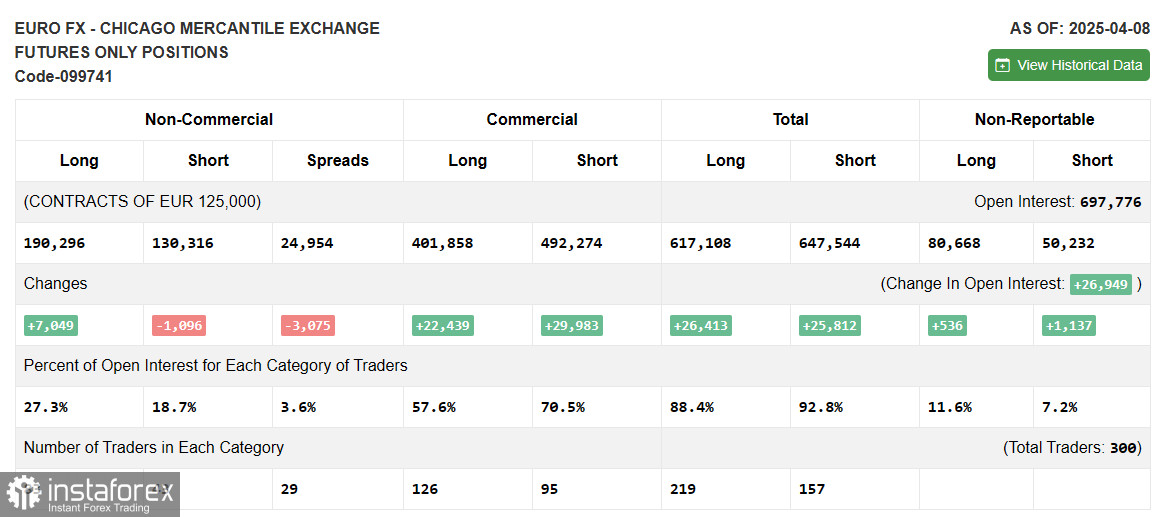
In the Commitment of Traders (COT) report dated April 8, there was an increase in long positions and a decrease in short ones. Given that Trump announced a 90-day tariff freeze, the euro managed to return to growth, clearly reflected in the increase in long positions. The fundamental statistics related to the decline in inflation in the eurozone also boosted demand for the euro, as markets now expect more decisive action from the European Central Bank to stimulate the economy. The COT report indicated that long non-commercial positions increased by 7,049 to a total of 190,296, while short non-commercial positions fell by 1,096 to 130,316. As a result, the net gap between long and short positions widened by 2,466.
Indicator Signals:
Moving Averages: Trading is taking place above the 30- and 50-day moving averages, indicating further growth potential for the pair.
Note: The periods and prices of the moving averages are considered by the author on the H1 chart and differ from the classic daily moving averages on the D1 chart.
Bollinger Bands: In the event of a decline, the lower boundary of the indicator around 1.1398 will act as support.
Indicator Descriptions: • Moving Average – Identifies the current trend by smoothing out volatility and noise. Period: 50 (yellow on the chart); • Moving Average – Period: 30 (green on the chart); • MACD Indicator (Moving Average Convergence/Divergence) – Fast EMA: period 12; Slow EMA: period 26; SMA: period 9; • Bollinger Bands – Period: 20; • Non-commercial traders – Speculators such as individual traders, hedge funds, and large institutions using the futures market for speculative purposes and meeting certain requirements; • Long non-commercial positions – Total long open positions of non-commercial traders; • Short non-commercial positions – Total short open positions of non-commercial traders; • Net non-commercial position – The difference between short and long positions of non-commercial traders.