empty
 
 
14.04.2025 06:47 PM
EUR/USD: Trading Plan for the U.S. Session on April 14th (Analysis of Morning Trades)

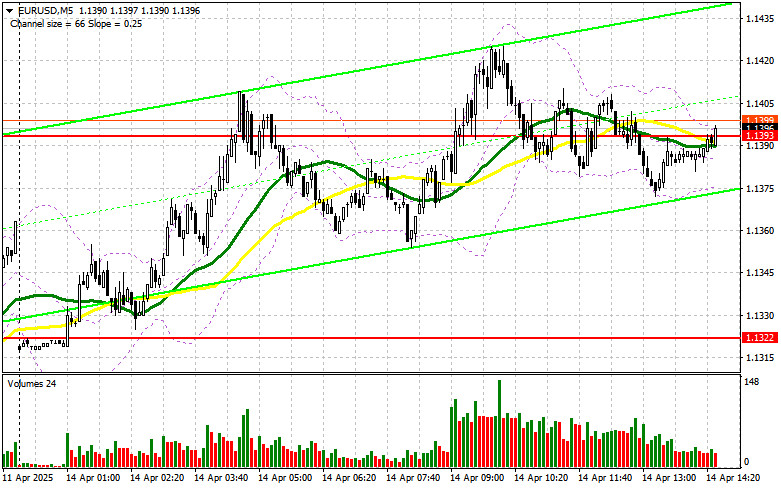
In my morning forecast, I highlighted the level of 1.1393 and planned to make entry decisions based on it. Let's look at the 5-minute chart and analyze what happened there. The breakout of this level did occur, but I did not see either a retest or a false breakout around 1.1393, so I stayed out of the market. The technical picture for the second half of the day remains unchanged.

This image is no longer relevant

To open long positions on EUR/USD:

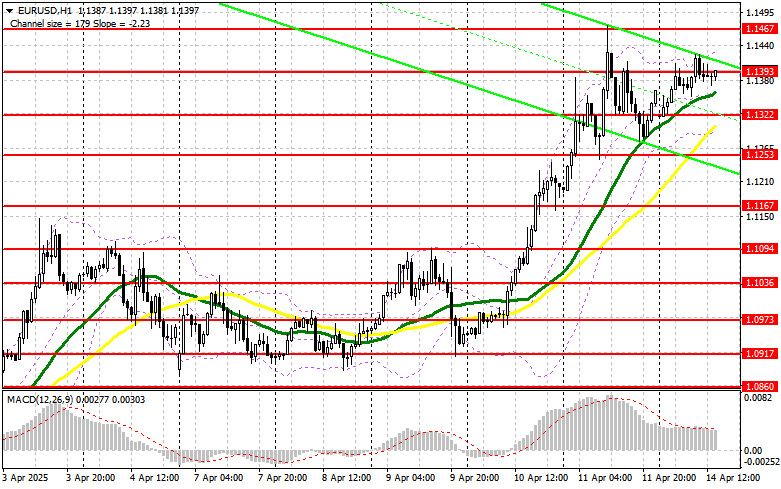
During the U.S. session, the only scheduled events are speeches from FOMC members Thomas Barkin and Christopher Waller. We'll listen to what they have to say regarding last week's inflation data and the outlook for monetary policy. If their stance turns out to be unexpectedly hawkish—which is unlikely—pressure on the euro may return, and I intend to capitalize on that. However, only a false breakout near the 1.1322 support level would serve as a signal to buy EUR/USD, aiming to resume the bullish trend with a target to revisit 1.1393, where trading is currently taking place.

A breakout and retest of this range from above would confirm a valid entry point for long positions, with the next target set at 1.1467, which marks the yearly high. The furthest target will be 1.1562, where I will look to lock in profits.

If EUR/USD falls and no activity is observed around 1.1322, pressure on the euro will likely increase at the beginning of the week. In that case, bears may drive the price down to 1.1253. Only after a false breakout at that level will I consider buying the euro. I plan to open long positions on a rebound from 1.1167, targeting a 30–35 point intraday correction.

To open short positions on EUR/USD:

If Fed officials deliver dovish remarks, the euro will likely continue rising. In that case, only a false breakout near 1.1393—which I didn't see during the first half of the day—would allow for short entries, aiming for a drop to the 1.1322 support level, where the moving averages are located and currently favor the bulls.

A breakout and consolidation below this range would be a solid selling opportunity, with a target at 1.1253. The furthest target will be 1.1167, where I will take profit.

If EUR/USD climbs again in the second half of the day and bears do not show any activity near 1.1393, buyers may return to the highs. In that case, I will postpone short entries until a test of the next resistance level at 1.1467, where I will sell only after a failed consolidation. If no downward movement occurs there either, I will look to short the pair from 1.1562, expecting a 30–35 point intraday correction.

This image is no longer relevant

COT Report (Commitment of Traders) – April 1:

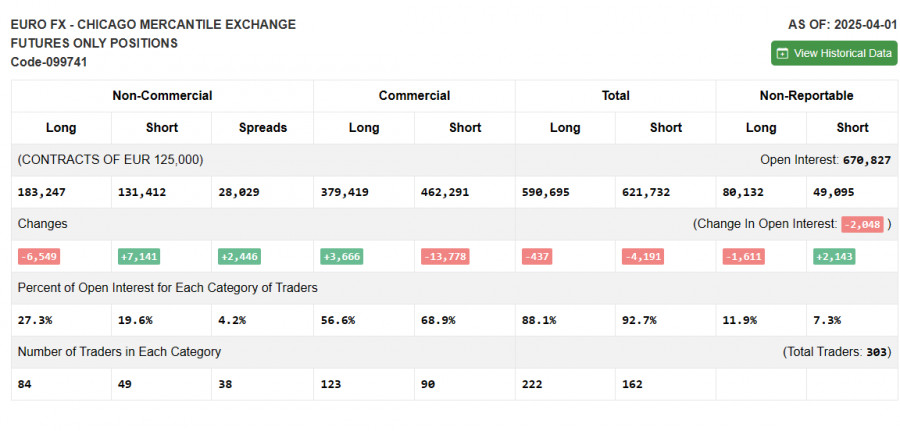
The COT report showed a slight increase in short positions and a reduction in longs. However, this data does not reflect the recent U.S. trade tariffs imposed on key partners or the latest U.S. labor market data from March. Therefore, analyzing this report in-depth is not meaningful, as it does not accurately represent the current market conditions.

According to the report, long non-commercial positions decreased by 6,549, to 183,247 and short non-commercial positions increased by 7,141, to 131,412. As a result, the gap between long and short positions grew by 2,466.

This image is no longer relevant

Indicator Signals:

Moving Averages: Trading is occurring above both the 30- and 50-day moving averages, indicating bullish control over the euro.

Note: The periods and prices of the moving averages are considered by the author on the H1 chart and may differ from the classic daily moving averages on the D1 chart.

Bollinger Bands: In the event of a decline, the lower boundary of the indicator near 1.1275 will act as support.

Indicator Descriptions:

  • Moving Average (MA): Determines the current trend by smoothing out volatility and noise.
    • 50-period MA is marked in yellow.30-period MA is marked in green.
  • MACD (Moving Average Convergence/Divergence):
    • Fast EMA – 12
    • Slow EMA – 26
    • Signal Line (SMA) – 9
  • Bollinger Bands: Period – 20
  • Non-commercial traders: Speculators such as individual traders, hedge funds, and large institutions who use the futures market for speculative purposes and meet certain criteria.
  • Long non-commercial positions: Total long open positions held by non-commercial traders.
  • Short non-commercial positions: Total short open positions held by non-commercial traders.
  • Net non-commercial position: The difference between long and short positions among non-commercial traders.
EURUSD
Euro vs US Dollar
Summary
Buy
Urgency
1 day
Analytic
Maxim Magdalinin
Start trade
Gana con los cambios en el valor de las criptomonedas con InstaForex.
Descarga MetaTrader 4 y abre tu primera operación.
  • Grand Choice
    Contest by
    InstaForex
    InstaForex always strives to help you
    fulfill your biggest dreams.
    UNIRSE AL CONCURSO
  • Depósito al azar
    ¡Haga un depósito en su cuenta de $3,000 y obtenga $1000 más!
    ¡En Abril, sorteamos $1000 dentro de la campaña Depósito afortunado!
    Obtenga la oportunidad de ganar depositando $3,000 en una cuenta de operaciones. Tras haber cumplido esta condición, se convertirá en un participante de la campaña.
    UNIRSE AL CONCURSO
  • Opere de forma inteligente, gane un dispositivo
    Recargue su cuenta con al menos $500, regístrese en el concurso y tenga la oportunidad de ganar dispositivos móviles.
    UNIRSE AL CONCURSO
  • 100% de bonificación
    Su oportunidad única de obtener un bono del 100 % en su depósito
    OBTENER BONO
  • 55% de bonificación
    Solicite un bono del 55% en cada depósito
    OBTENER BONO
  • 30% de bonificación
    Reciba un bono del 30% cada vez que recargue su cuenta
    OBTENER BONO

Recommended Stories

¿No puede hablar ahora mismo?
Ingrese su pregunta en el chat.
Widget callback